There are multiple ways of measuring the yield curve, but for the purposes of this post, we will be focusing on the short-end only, meaning the difference between the 2-year note yield and 3 month T-Bill rate. In a normal market, interest rates at two years trade above those at 3 months, because there is greater risk in lending for a longer period of time. Occasionally, however, short rates rise above long rates. In the US, this inversion has happened 15 times since 1960. In a fuller global set of developed markets that excludes the US, this inversion has happened 409 times since 1960. Yield curve inversion is traditionally seen as a negative, either a sign that banks will refuse to lend at rates below deposit rates, or that monetary policy is too tight. What we see when we look at the data is that while inversion of the short-end of the yield curve is bad economically across almost all countries, and also bad for US financial markets, the results for financial markets outside the US are actually (and surprisingly) positive.
To measure economic impact, we will look at two simple metrics: industrial production and retail sales growth. In each chart you will see what has happened in the two years following each yield curve inversion, on average.
The first chart shows what has happened to industrial production both in the US and the rest of the developed world over the last six decades after 3-month rates rise above 2-year yields (having been below the prior month). In the US, the results are bad for the next two years (with growth only beginning to come out of its decline after 21 months). We see a pretty similar story outside the United States, though because this is a much larger average of countries and outcomes, the results are more muted. After a yield curve inversion, most developed countries’ industrial production declines about 1% and remains depressed for about 18 month before beginning to rise again. There are a few exceptions, notably the English speaking countries. Australia, Canada, New Zealand, the UK and Singapore show little to no decline in industrial production.
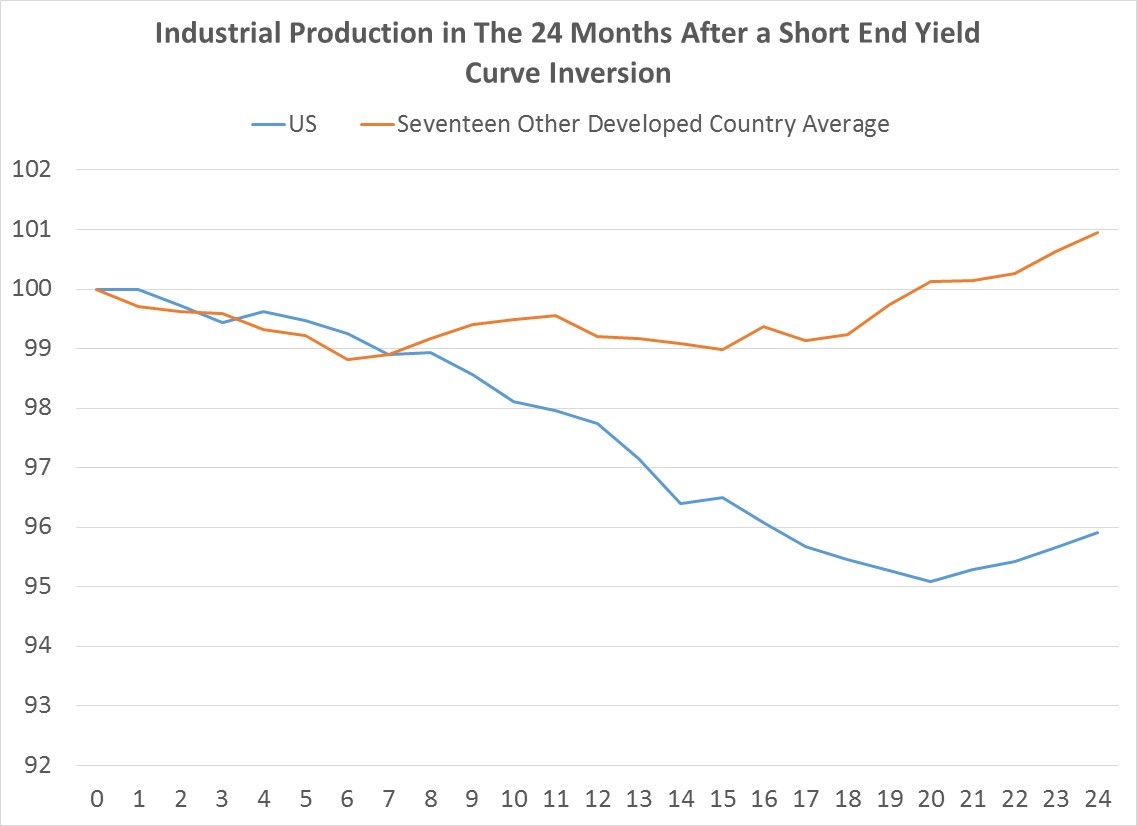
(Data Sources: Federal Reserve, US Census Bureau, as well as other Central Bank, Ministries of Finance & National Statistical Offices for non-US countries)
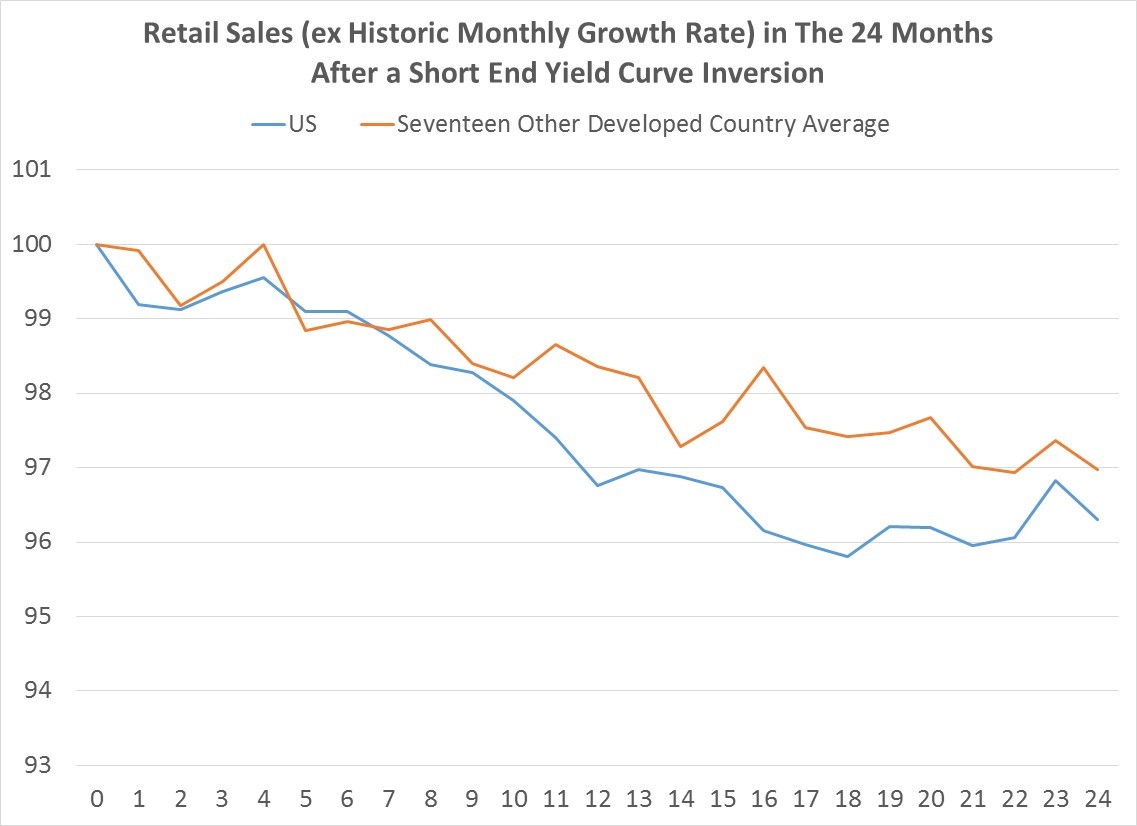
The next chart shows what happens to retail sales. Unlike industrial production, which can frequently actually contract, retail sales almost always grow, so to adjust for this, the chart shows how much retail sales are weaker than the long-term growth rate in each country. Whether it’s in the US or the rest of the developed world, yield curve inversion at the short end of the curve leads to below trend consumer spending. Only one country is an exception to this: Italy. Don’t ask, I don’t know why.
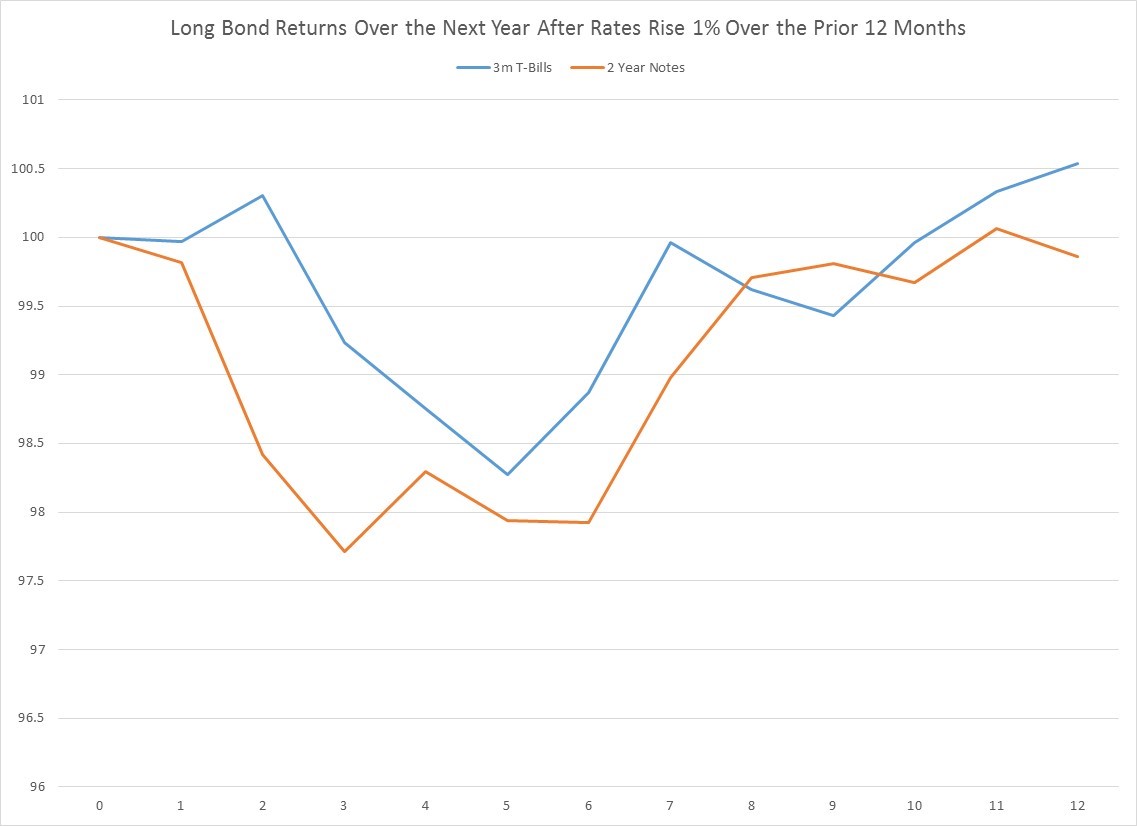
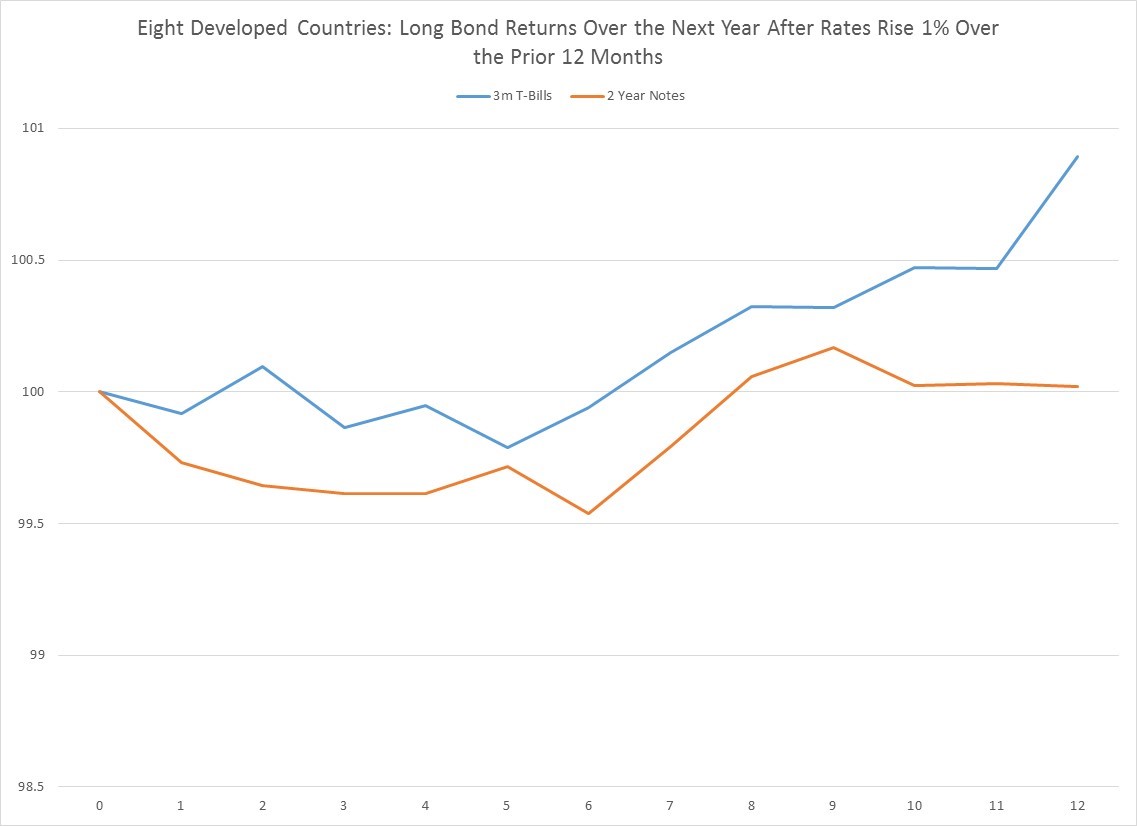
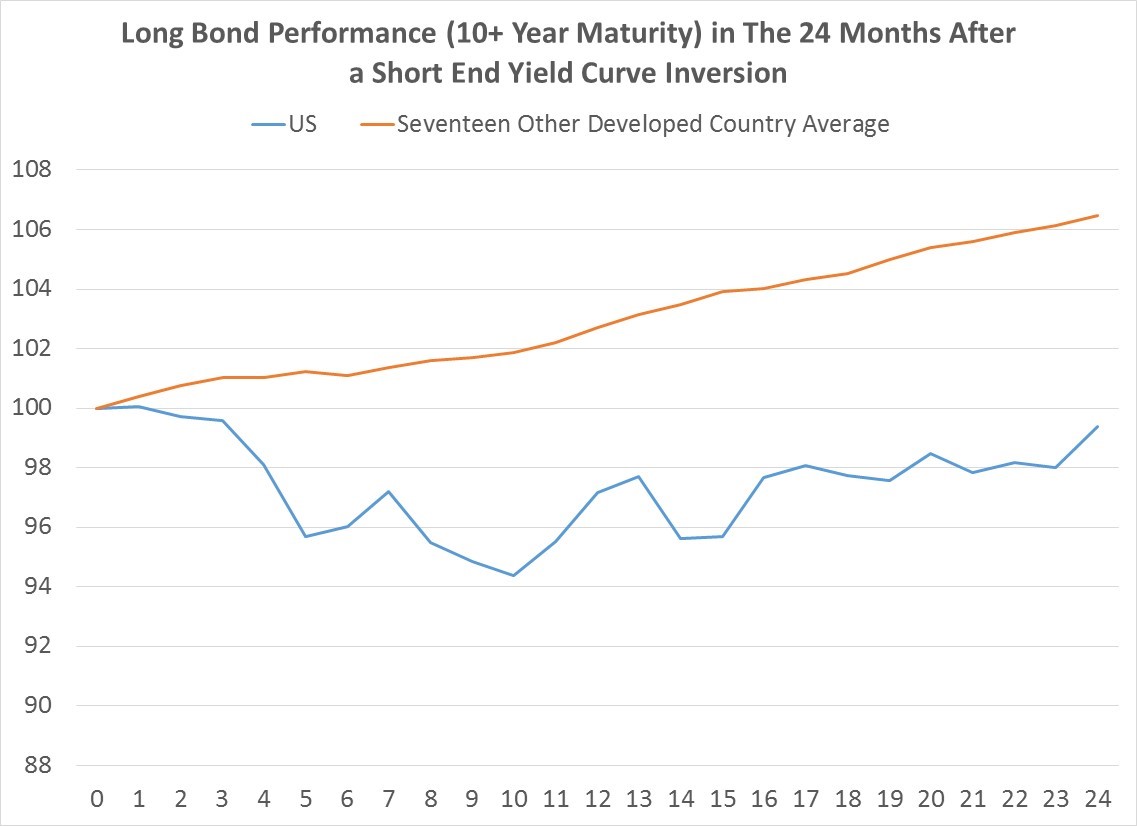
With all that horrible economic news a yield curve inversion should be bullish for longer maturity (10+ year) bonds, since there is almost no inflation threat on the horizon. Turns out that this logic does indeed hold, except in the US. As you can see in the next chart, in the first 9-10 months after the US yield curve flips, longer bonds actually decline. By contrast, in the rest of the developed world, inversion is universally positive for bond prices. After one year, every non-US developed country’s average bond market is higher than when the inversion happened.
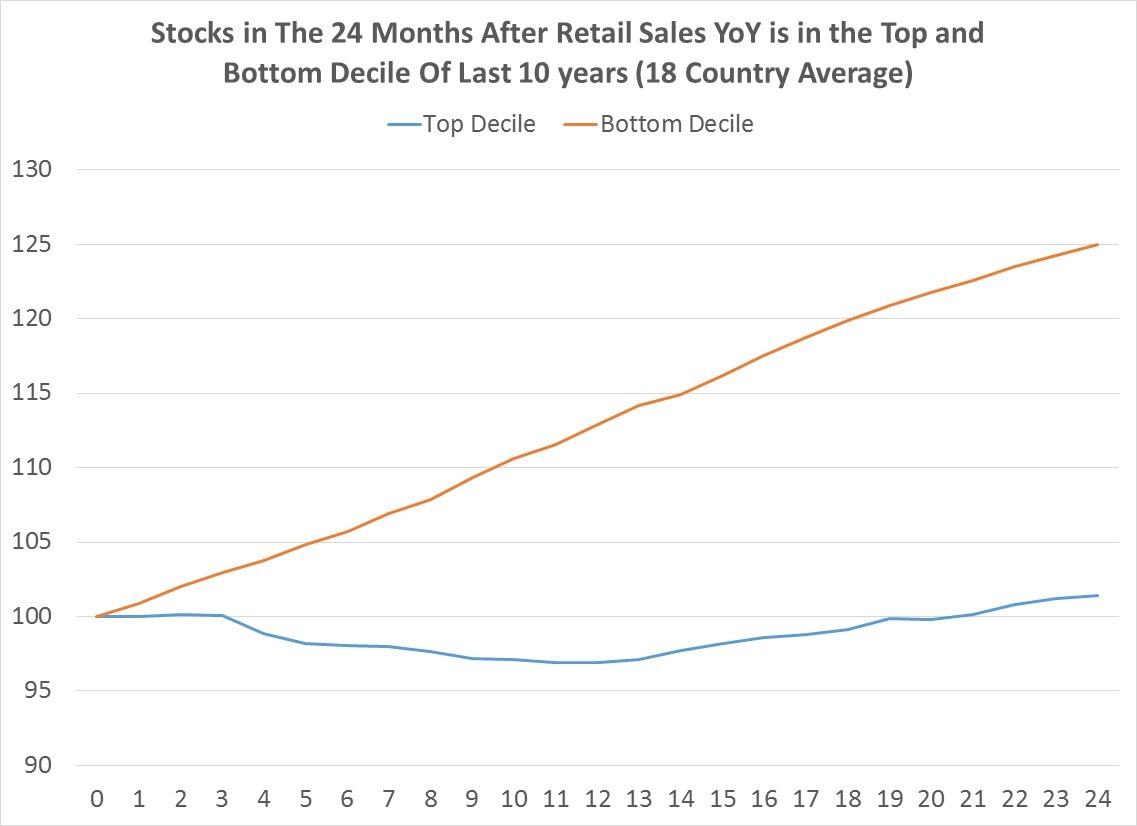
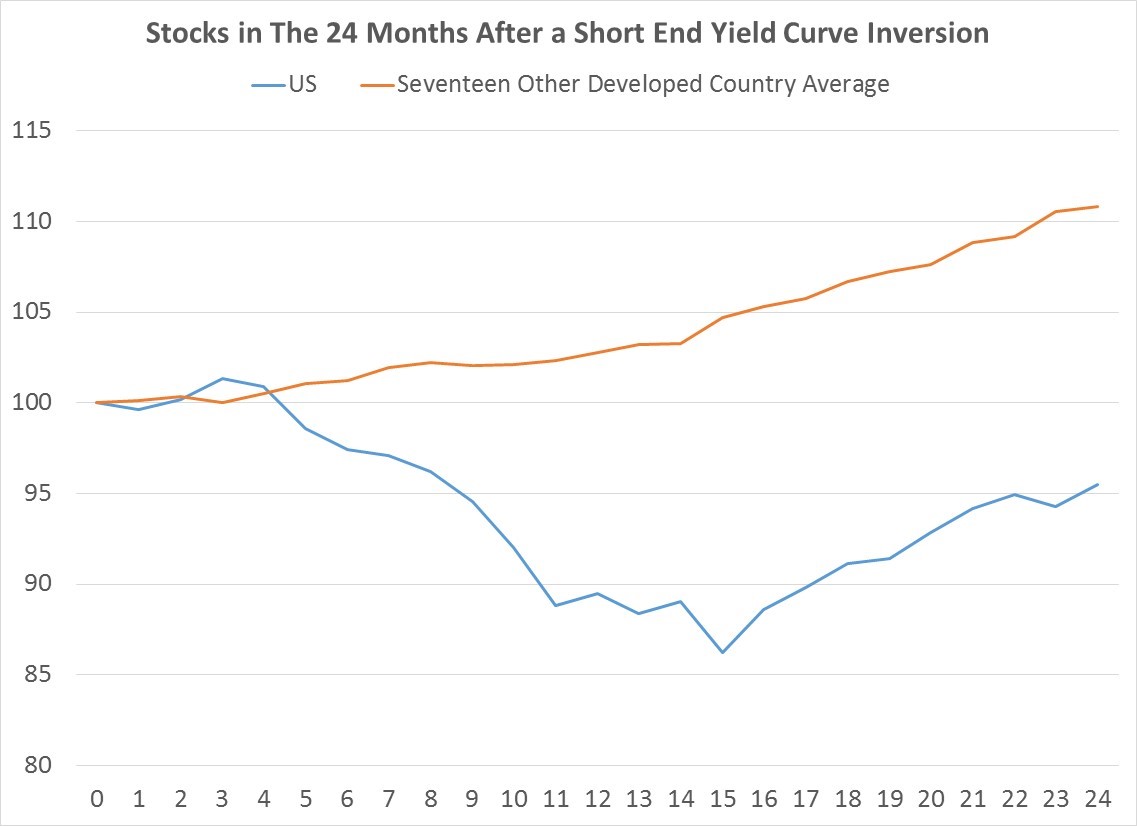
Finally, let’s consider the impact on stocks. Looking at the last chart, one can see that yield curve inversion is pretty terrible for US equities, which decline, on average, about 14%. By contrast and somewhat surprisingly, most other developed countries actually experience stock appreciation after an inversion, though there is some variation, unlike in bonds. After one year, Italy, Hong Kong, the Netherlands, Denmark all show lower stock prices, but after 24 months all markets, except the US were higher on average.
To tie up, yield curve inversion at the short end of the curve is almost always followed by economic weakness. Whether it is a driver or simply coincidental is a question I cannot answer. What is clear is that economic contraction following an inversion is a pretty universal phenomenon in developed countries.
What the inversion means for financial markets shows a bit more variation. In the US, the results are bad whether you are in stocks or bonds, though it’s a lot worse in stocks. Other developed countries universally experience bond rallies, probably as a result of weak economic news. In general, global developed stocks also rally eventually following an inversion as well, perhaps because their longer term rates are moving lower. Put another way, the decline in US stocks and bonds following a yield curve inversion at the short end of the term structure appears to make the US the exception to the more universal rule.
Please follow and like us: