Assume its 1984, and you have 3 investment choices in front of you:
- Stocks: Buy the S&P 500 Index and pay 50 bps in fees per annum.
- Bonds: Perpetually buy 10 year bonds and pay 30 bps in fees a year.
- Managed Futures: Build a trend following portfolio around 4 futures contracts: S&P 500 futures, 30 Year Bond futures, Crude Oil Futures and US$ futures, since each represents a different asset class. At each month-end, for each of the 4 contracts, you go long a contract when its 1 year trailing return is positive, and short when it is negative. Equalize the risk of all 4 contracts, and penalize your returns by a) assuming you pay 1% a year in commissions, rolls and fees, and b) ignore your return on the cash that is not being held as margin, which up until recently considerably boosted your returns.
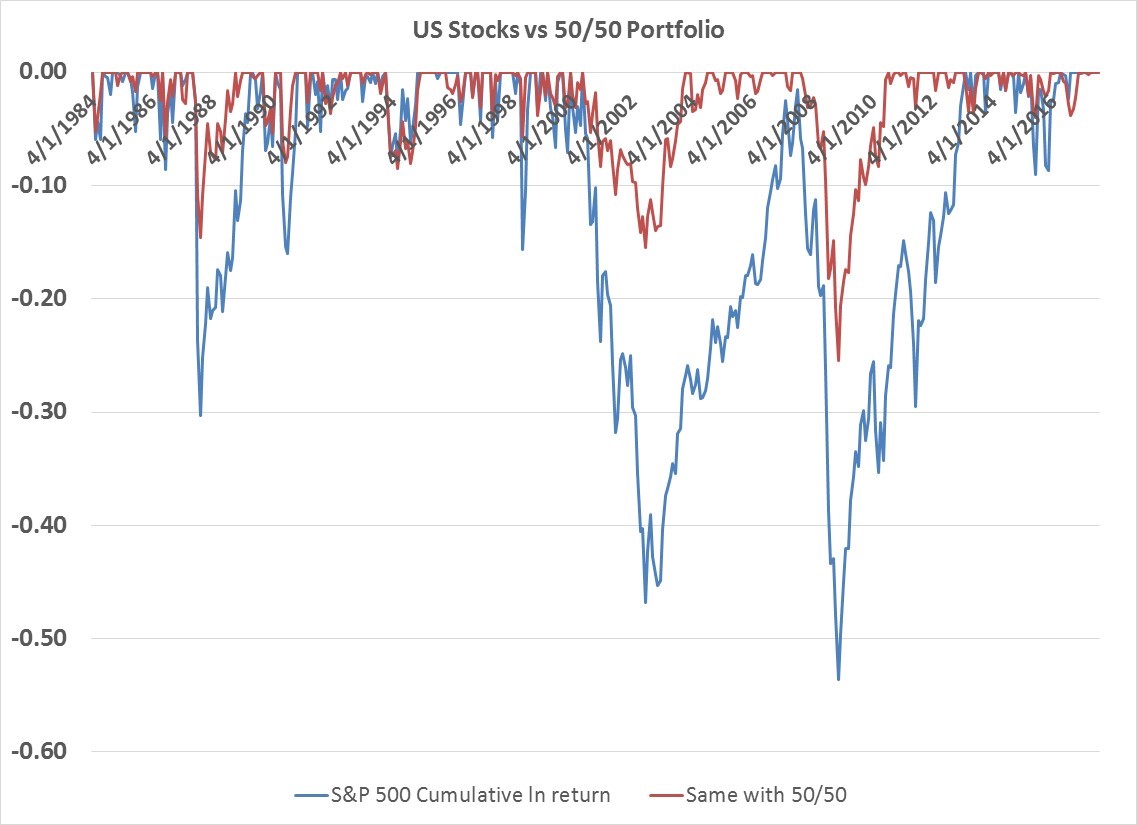
The simple portfolio of investing 50% of your money in stocks and 50% in bonds turns out to be quite attractive over the last 30+ years. Your returns are only 0.8% lower than if you had held equities alone, because long maturity yields fell dramatically over this period, so your equally blended portfolio achieves almost the same return with a fraction of the risk, whether you define risk as annual standard deviation (volatility) or maximum % loss.
The only real drawbacks to this portfolio are a) going forward your bond returns (at current low yields) are extremely unlikely to be this high, and b) at some point along the investment path, you still can expect to lose 25% of your money.
| S&P 500 | 10 Year Bond | 50/50 Port |
|
|---|---|---|---|
| Avg Annual % Return | 8.9% | 7.3% | 8.1% |
| Annual Volatility | 14.8% | 7.8% | 8.3% |
| Return to Vol Ratio | 0.60 | 0.93 | 0.98 |
| Maximum % Drawdown | -54% | -11% | -25% |
This is the 50/50 portfolio compared to equities alone.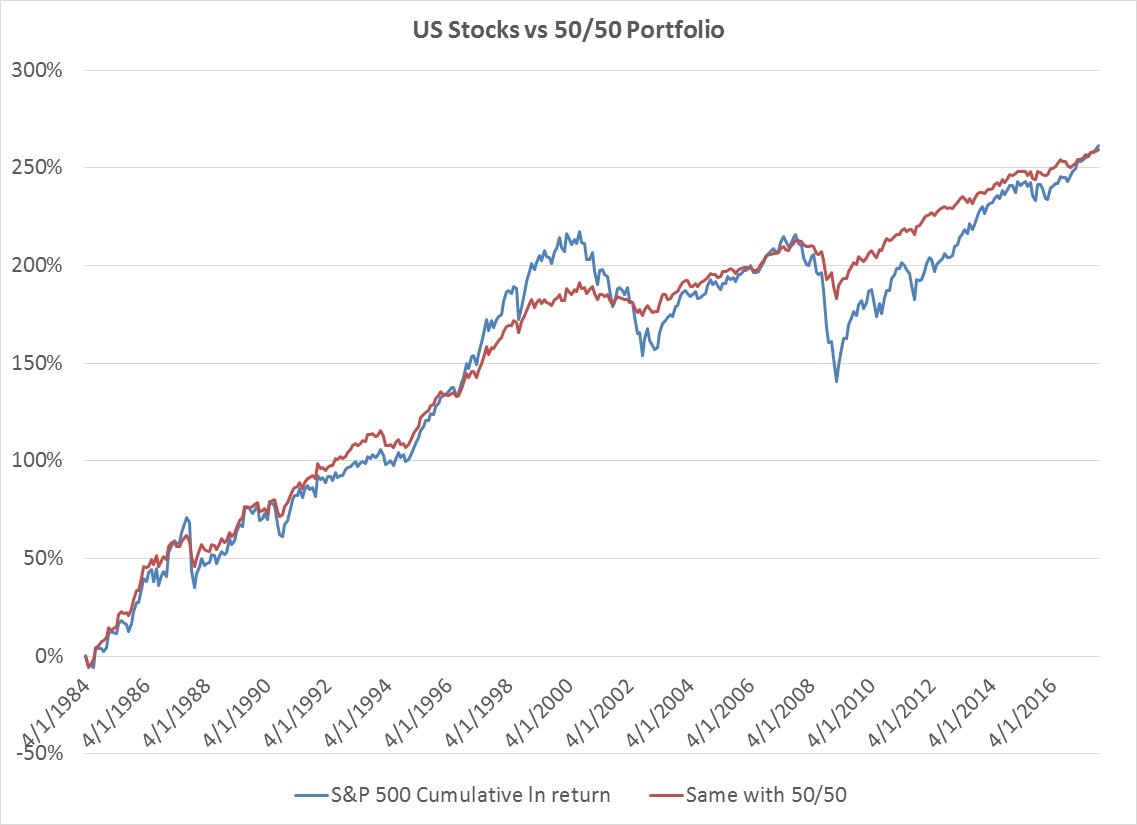
This is the max percentage drawdown or loss you would experience in each portfolio.
Consider adding the third strategy, which only requires trading once a month. First compare the performance stats of all three strategies over the last 33 years in isolation. A simple managed futures strategy has volatility and returns that fall between stocks and bonds, and a return to risk (or information ratio) between the two asset classes (with drawdowns slightly worse than bonds alone).
| S&P 500 | 10 Year Bonds | Mngd Futs |
|
|---|---|---|---|
| Avg Ann % Return | 8.9% | 7.3% | 8.0% |
| Annual Volaility | 14.8% | 7.8% | 11.2% |
| Return to Risk Ratio | 0.60 | 0.93 | 0.71 |
| Max % Drawdown | -54% | -11% | -18% |
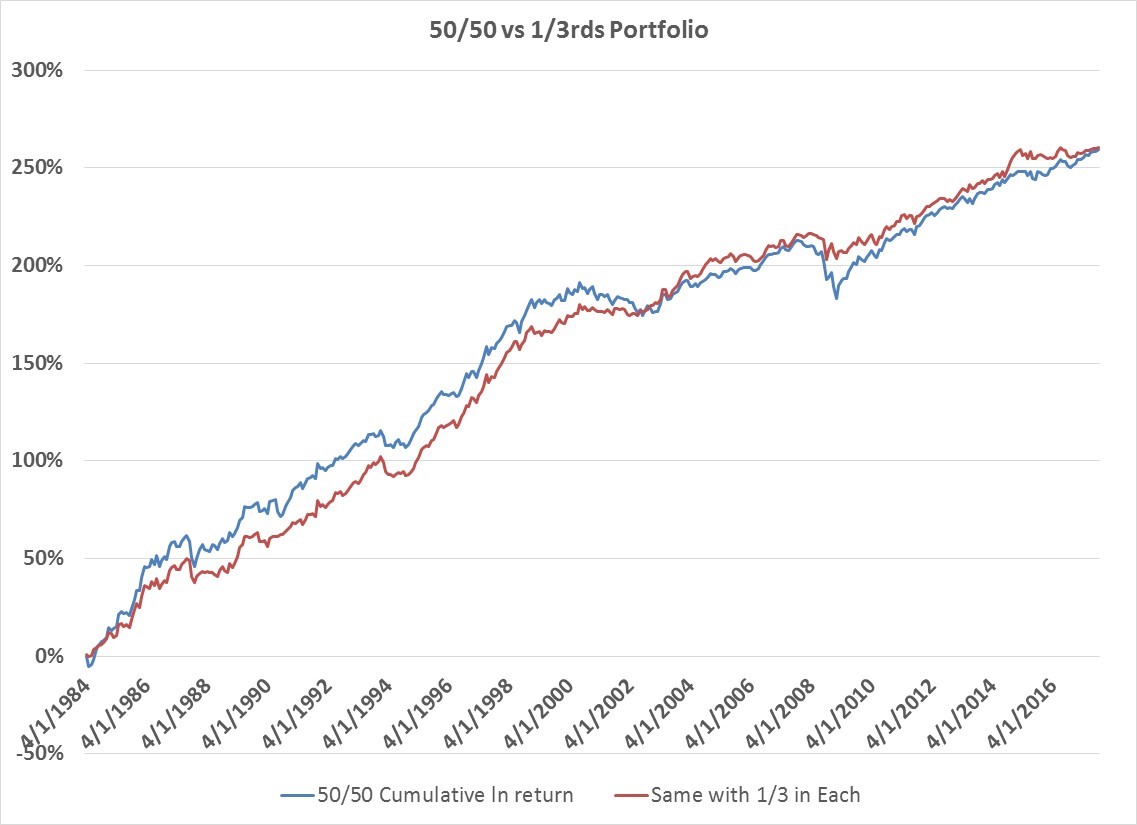
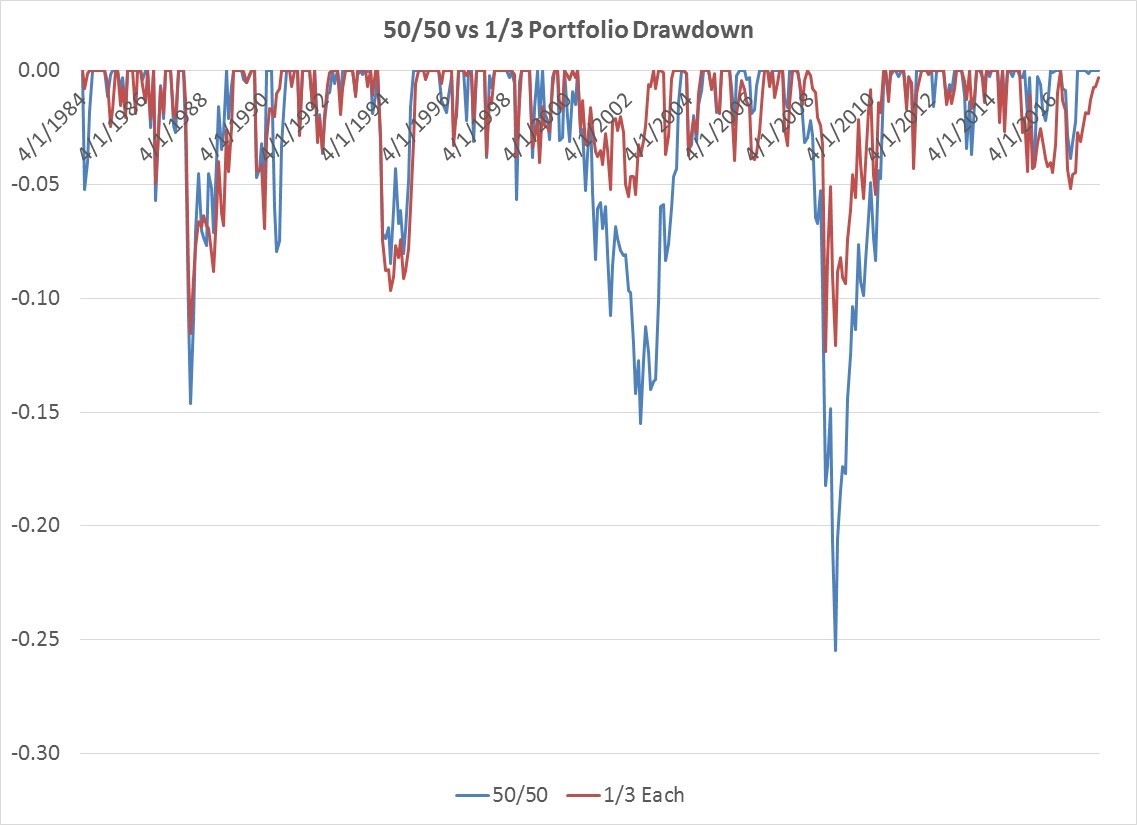
Putting the 50/50 portfolio side by side with a portfolio that puts 1/3rd in each strategy, an investor ends up with pretty much the same return, but the risk, as measured by volatility improves, while your max percentage loss is cut in half from -25% to -12%.
| 50/50 | 1/3rd Each |
|
|---|---|---|
| Avg Ann % Return | 8.1% | 8.0% |
| Annual Volatility | 8.3% | 7.3% |
| Return to Risk Ratio | 0.98 | 1.10 |
| Max % Drawdown | -25% | -12% |
Below is a chart of the two portfolios cumulative returns through time. You start and end up in virtually the same place, but the ride is a lot smoother.
And the two max % drawdowns in the portfolios.
 There are other ways of slightly improving the portfolio blend—you could add more than 4 futures to your managed futures strategy for further diversification. Similarly, a risk parity version of the 1/3 portfolio that equalizes volatility among all 3 strategies improves your risk-adjusted returns and brings your max % loss down to -10.4% from -12.4%.
But all this is making a simple message more complicated—the value added from a managed futures allocation, whether you DIY or outsource it is huge. The only free lunch in investing is diversification, and managed futures are a huge diversifier. The simplistic managed futures strategy simulated here has a 0.10 correlation to US stocks and 0.28 correlation to 10 Year Treasury returns. Managed futures can and will have periods where returns are unflattering when viewed in isolation. But that’s missing the point. Investors should seek out multiple return streams with positive expected return over a reasonable time horizon that diversify their portfolios and blend them together. Managed futures fit this diversification role perfectly.