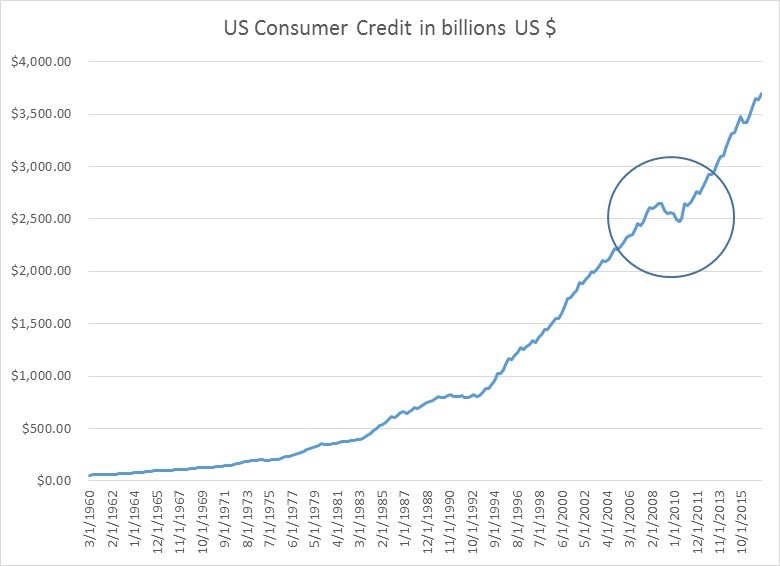
With the exception of a few anomalous periods, consumer credit has pretty much always grown (as you can see in the first chart below). Not shockingly, it actually contracted briefly during the crisis of 2008, as households cut back.
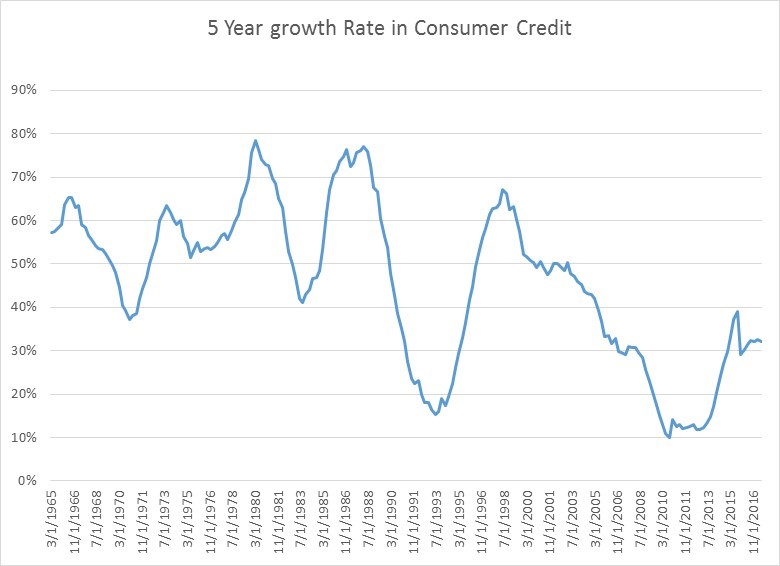
When you look at longer-term growth rates in consumer credit, things look fairly normal. We are not near historic 5 year growth rate lows of 10%, like we were in the crisis, or even the 20% lows we saw in the early 1990s. Consumer credit 5 year growth is hanging in there around 30%, which is historically a little on the low side, but not terribly so.
Dig a bit deeper beneath the surface, however, and you do see two interesting recent trends.
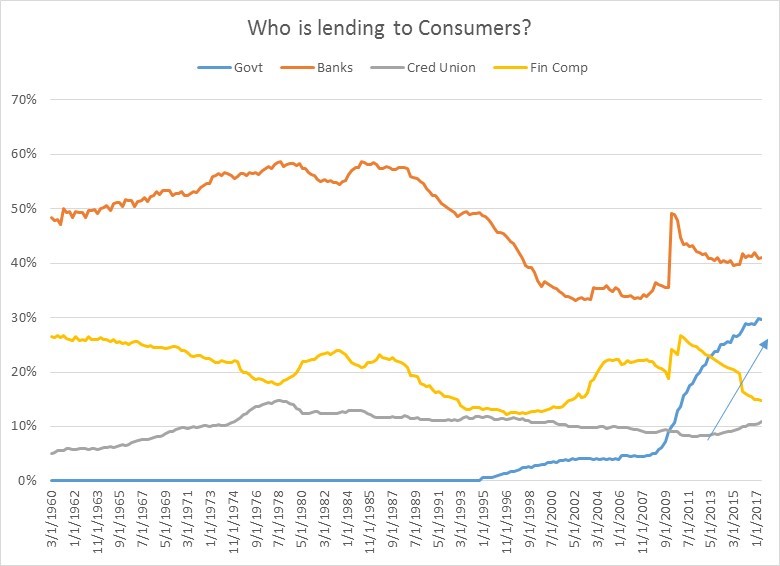
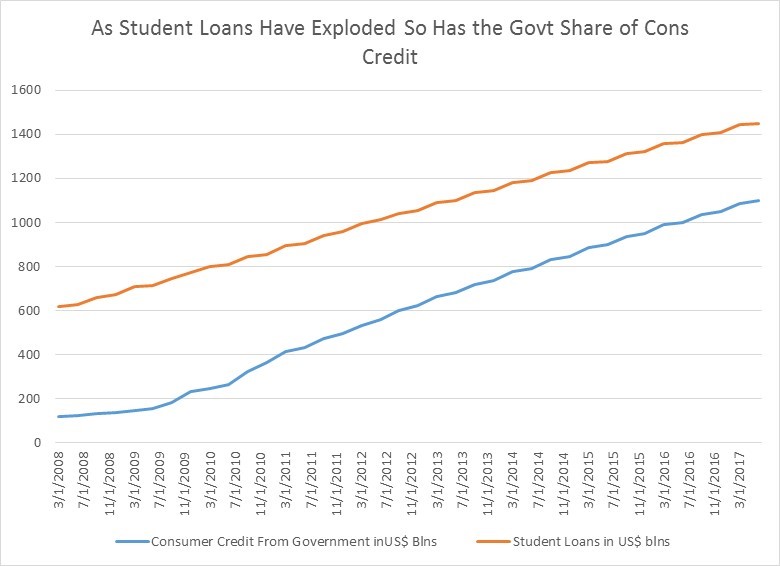
First, the government has become a major player in consumer credit markets, especially since the financial crisis when risk averse financial institutions became much stingier. Below is a chart of the composition of who is lending to consumers by institution type. Banks have always been, and continue to be, the largest providers of consumer credit. Historically, they have provided 50-60% of consumer funds, though that has dipped closer to 40% since the mid 90s. Financial companies and credit unions show some variability through time, with financial companies seeing a 10% decline in their share of the lending market since 2010. But by far the largest change, and the one most worrying if you are a believer in free markets, is the huge jump in the presence of the government in providing credit: the government is now close to 30% of the consumer credit market now vs. 5% ten years ago. This is almost entirely a result a second secular trend in the credit markets—the explosion of student debt.
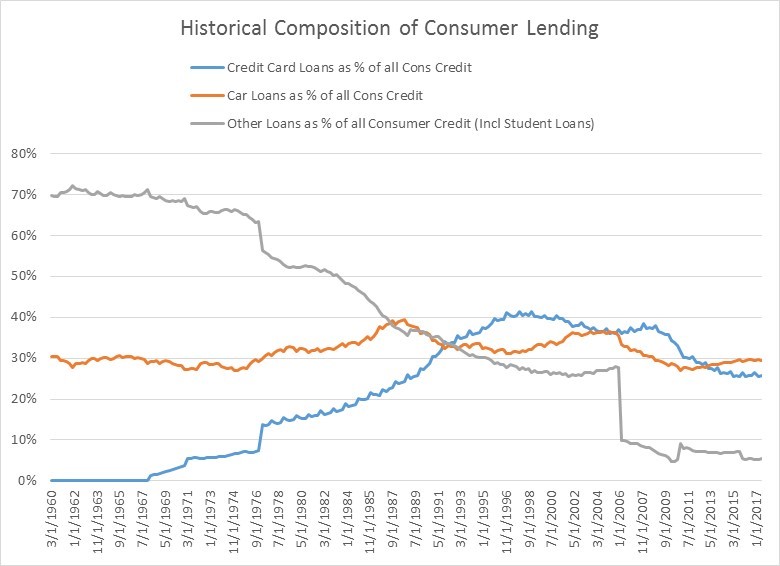
If you look at a longer-term historic chart that breaks down what types of consumer loans were taken, you don’t get a ton of insight because student loans have only been broken out by the Fed since 2006.
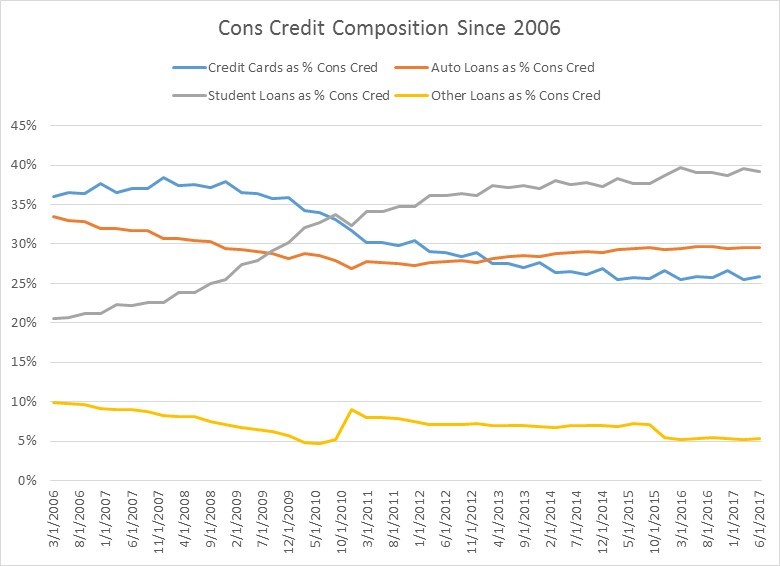
What’s interesting is how credit card debt was fairly non existent in the early 1970s at a mere 5% of consumer debt and ran up to 40% in the late 90% and has since come back down closer to 25%. Car loans, by contrast, have been pretty steady at 30% of total consumer credit.
It’s only when you look at a breakdown of consumer credit since 2006 (when the student loan data becomes fully available) that the changes in US consumer debt composition become so obvious. As you can see in grey line in the chart below, student loans have moved from 20% of all consumer credit in 2006 to close to 40% now to become the largest percentage of all consumer credit.
The government’s increasing market share of consumer credit is directly tied to the rapid growth in student loans.
The problem is that, in the long run, the growth rate in student loans is utterly unsustainable. There is too large a gap between the higher growth rates in student loans and lower growth rates in household incomes. As we learnt from the last crisis, there is only so long that debt growth can outrun income and asset growth. If borrowing growth exceeds income growth, debt payments either cannot be made and we get defaults, assets have to be liquidated to fund debt payments (young people out of school however have no assets), or students will have to go to family to fund their debt. None of this is good for consumption or the growth in earnings of companies are tied to younger consumers.
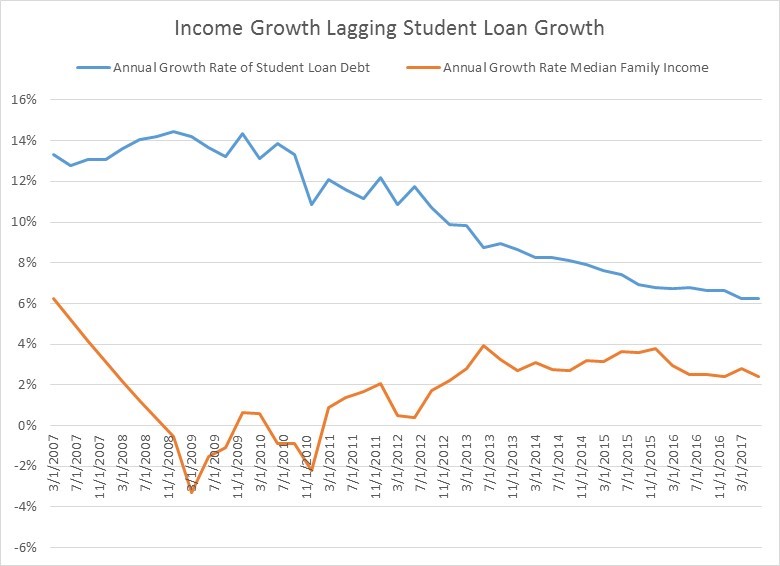
At some point either student loans growth will have to slow, or these loans will have to be written down. This may or may not be a “credit bubble” since bubbles typically require some leverable asset that increases in value, but nomenclature aside, at some point there will be reckoning.